The Fair Value can be calculated not only for a simple option contract but for any option combination. After all, this is a payoff at expiration weighted by some probability measure.
The Payoff function is not limited to the one of a call or put option, it can be of any form. For example, here is a payoff of a Long Straddle — a combination of the long put and long call with the same strike.

As with the payoff of a single contract, it is possible to weight that combined payoff by some probability function (put a probability measure) and get the Fair Value of this option strategy.

Then, by comparing that number with the market price, we can get its expected profit/loss. The same way as with a single option contract.
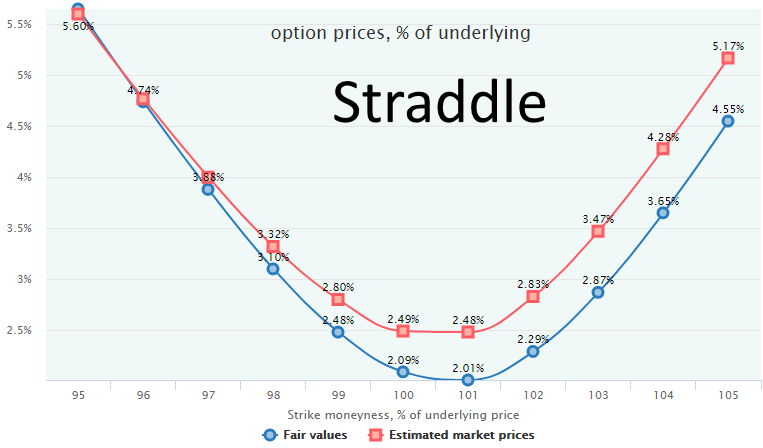
Here is an example of straddles on SPY with comparison of their Fair Values and Estimated Market Prices across 95-105 moneyness — 11 straddles in total. Straddles are constructed of 2-week options, for the time period of 2010-2016.

This chart shows that during 2010–2016, straddles have been mostly overvalued and selling them would be a profitable strategy, while buying would lose money on average.
Any strategy can be evaluated with such an approach. The only limitation is that all the options (strategy legs) must have the same expiration date. The reason is that any type of a calendar or diagonal spreads or other strategies with different expirations for their legs have no one single date at which we can take a combined payoff. Therefore, if we choose one particular expiration of some leg (say, front leg expiration date of a calendar spread), we need to evaluate the market price of the remaining legs which are not yet expired (the farther legs).
Technically, it is possible to make an estimation of the market price of the not-yet-expired leg in the past — for each day when we calculate the payoff of the expiring leg. Such an estimation can be done with the help of the regression models of Implied Volatility vs. Volatility Index. Here we would have the desired payoff of a combination, pretending that we close the whole position at that moment at this Estimated Market Price, and calculate the Fair Value of the whole combination.
However, this “Fair Value” would take into account the market views on options pricing and incorporate this view into the estimation of the Fair Value of a combination. At the same time, the whole idea of the Fair Value is to find an “objective” fair price of hedging/insurance which depends solely on the underlying security movements and isn’t taking into account what options traders think about probabilities.
The expected profit/loss is not the only metric that the OptionSmile methodology can provide. For example, we know the margin requirements of a strategy and can calculate a profit relative to that value – Return-on-Margin (RoM). In the same way, we know the position value (market price for the strategy), either current or average historical, and can find a Return-on-Market Value (RoMV). Having position delta, we can calculate Return-on-Delta. By setting the position sizing parameter, we can have a Return-on-Portfolio (RoP).
But the most valuable performance metrics are those relating the expected profit with the associated risk (risk-adjusted performance).
In fact, the Fair Value is an arithmetical average of historical payoffs of a hypothetical option. It is calculated on some historical dataset (Filter Bin), and for each day in this dataset, we also have an estimation of the market price of this contract. That means that we have the market price of a contract, know how it had expired, and, hence, its profit/loss at expiration – for each day in history.
That provides us with the whole probability distribution of the profit/losses and gives us the ability to calculate the various risk metrics for a strategy:
It is also possible to visually analyze the PL histogram to identify the shape of PL distribution, its skewness, asymmetry, and so on.
Some parameters related to the money management and optimal position sizing (Kelly criterion and alike) are also easily calculated having the whole distribution data.
For more details about the strategy performance metrics, see the respective section of the Tutorial.