This post was originally published on SeekingAlpha.com.
Summary:
Various pieces of evidence exist confirming that put options on wide equity indices are permanently overpriced by the market. The excess demand for the long portfolio protection is believed to be the main reason for that. For more about systematic puts overpricing, please see here.
During the market sell-offs, that overpricing is even more staggering: The options market lifts prices of put options hugely above their fair values, which are equal to the probability of the in-the-money expiration times the expected option value is that case. You can find this approach to the fair value calculation in this Seeking Alpha blog post: “What Is The Fair Price Of An Option You Buy Or Sell?“
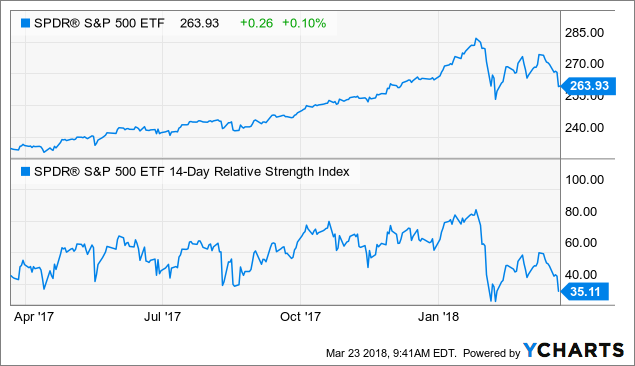
Below, we will use the Relative Strength Index – RSI(14) – as a filter to calculate the fair values of, say, put options on SPY with expiration on April 13, 2018 (a three-week period). We consider RSI(14) below 40 as an oversold market signal; at the time of writing, March 23, 2018, it is around 35.

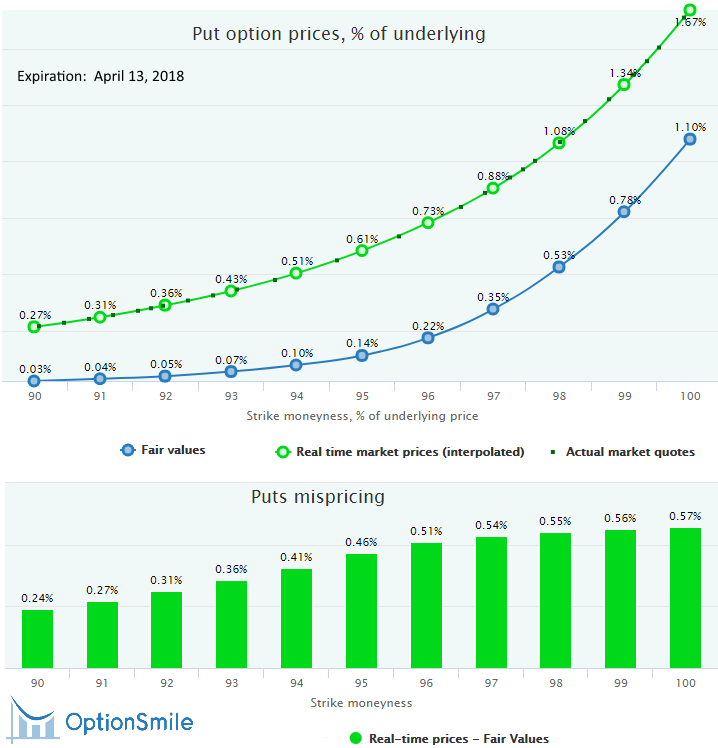
Here is the mispricing chart comparing the current market prices (green line) of our options with their fair values (blue line), which have been calculated based on the dates in SPY history when its RSI was around 35 and VIX was around its current level of 22 (300 data points):

For more information about the filtering logic, please see here. We have also filtered out the recessionary environment when the half-year rate-of-change of the Conference Board Leading Economic Index was below -2% (we only consider healthy economic periods).
Obviously, the difference between the fair and market prices is huge – it actually constitutes the expected profit of a seller and the expected loss of a buyer (see the lower diagram). It is not guaranteed, of course, and the market can continue its way down and entail a loss for an option seller (“buying the dip” does not work out in 100% of cases).
However, on the basis of historical data, it is very unlikely. After some number of trades, the result should converge to its mathematical expectancy. In practice, the sum of premiums received by selling of these overpriced puts should eventually exceed the losses of all in-the-money expirations.
Of course, this is an extremely risky strategy and selling naked puts is a sure way to lose everything. No matter how huge the expected profit is, if you have a non-zero probability of ruining the portfolio, it will happen eventually in the case of a catastrophic event. Therefore, the tail risk hedging is essential with, say, buying a farther OTM put and, hence, converting that naked put strategy into a credit put spread. Yes, that hedging long put is also overpriced but the expected loss of buying it will be less than the expected profit of the short leg. The overall expected profit is still positive.
Here is an expected profit of the credit put spread (96/90) for the SPY options from the example above (all values are presented as a % of current SPY price – $263.93):
| Leg/strategy | Fair Value | Market Price | Overpricing |
|---|---|---|---|
| Short leg – 96 moneyness | 0.22% | 0.73% | 0.51% |
| Long Leg – 90 moneyness | 0.03% | 0.27% | 0.24% |
| Credit Put Spread | 0.19% | 0.46% | 0.27% |
Fair value is a multiplication of the ITM expiration probability and expected value in the case of such expiration: FV(96) = 10.7%*2.1%=0.22%, FV(90) = 1%*2.8%=0.03%.
So, we have the expected profit of 0.51% ( $263.93 * 0.51%*100 = $135) per option in the short leg, and expected loss of -0.24% ( $263.93 * -0.24%*100 = -$63) per option in the long leg. In total, it is 0.27% ( $263.93 * 0.27%*100 = $72) expected profit per strategy. In other words, we expect to give up $63 as a loss of ITM expirations per each $135 of the credit received, on average.
Importantly, since this strategy inevitably entails substantial drawdowns at times, it is also crucial to adhere to the strict money management rules and properly select the position sizing to avoid overbetting (e.g., after losing 50% you will need to earn 100% to break even).
Of course, it is possible to exploit such an “oversold” market with just the underlying security. Why not simply buy SPY if it is expected to bounce back with high probability (after all, the average SPY return in our three-week period is 1.22%, or 22% annualized, in our historical sample)?
Yes, it is possible. But with options, we can have two sources of profit at once: not only the expected upcoming move but also the market’s overestimation of the probability of going further down (overstated implied volatility, in other words). If the former factor does not work out and SPY goes further down harming the long (delta) position, you still will be able to make a profit from the latter one. Simply put, the underlying may continue sliding but if your short put is far OTM enough, you have some wiggle room for SPY until it hits your breakeven point.
Another advantage of options in these cases is that it is possible to fine tune your strategy with varying the strike and selecting the probability of success that suits your risk appetite and/or other portfolio holdings. You can choose higher probability trade with a lower expected profit of a trade with higher profit expectation, but with lower probability.
Besides the pure speculative trades that can be done based on this analysis, the big positive expected profit of option strategies can be also used to lower the cost of the long-term portfolio hedging. For instance, it’s well-known how expensive a protection with the outright put options is. The simple puts buying will eat up the major part of your portfolio returns (various research papers confirm that).
However, if we combine the long-term protection (with, say, LEAP put options) with the exploiting of the short-term market mispricing like the one described above (and many others), we can substantially decrease the total cost of hedging. We just need to make some number of such trades to force the probabilities and expected values to realize in practice.