There are various pieces of evidence exist confirming that put options on wide equity indices are permanently overpriced by the market. The excess demand for the long portfolio protection is believed to be the main reason for this.
This research conducted using the OptionSmile platform underpins that observation and confirms that a put options selling has abnormally high expected profit.
However, on the risk-adjusted basis, such a short put strategy does not look so attractive due to the high volatility of results and regular huge drawdowns: the Sharpe ratio of a put selling, even with limited risk (spread strategy), is not so attractive and does not differ significantly from the Sharpe ratio of the outright long position in the underlying security.
Therefore, that high profitability of puts should be considered as a volatility premium rather than a market inefficiency.
This phenomenon is often referred as "overpriced puts puzzle" or "put anomaly" in the academic research papers. The reasons are believed to be the following:
We will use the put options on SPDR S&P 500 ETF (SPY) for our analysis. However, all other major US equity indices demonstrate very similar results: Dow Jones Industrial Average (DIA), Russell 2000 (IWM), Nasdaq-100 (QQQ), and even equity index of the developed countries excluding US and Canada - MSCI EAFE (ticker EFA).
For our analysis we take 4-week (20 trading days) SPY put options for the 24 years period: September 1993 to September 2017, without any filtering. The statistics of the underlying returns are the following:

Here are the Fair Values against the average Estimated Market Prices of these put options:
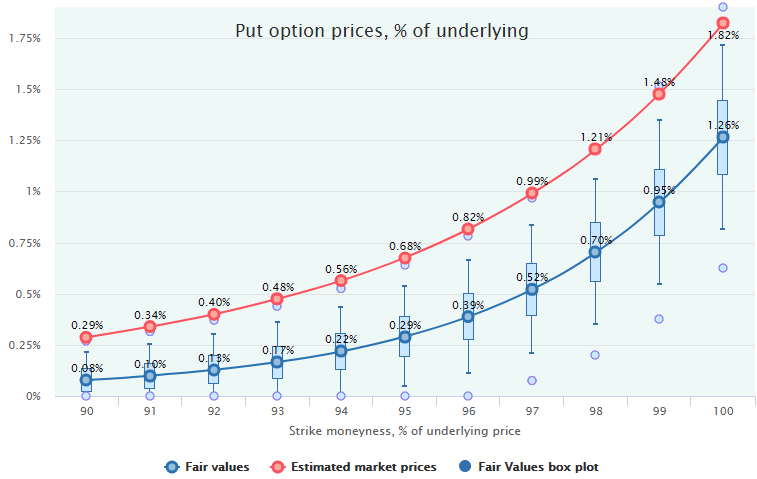
Obviously, these options have been overpriced on average during this 24-year period including two severe bear markets: dotcom bubble burst in 2001-2002 and financial crisis in 2007-2008. The Fair Value box plots also confirm that such a mispricing is statistically significant.
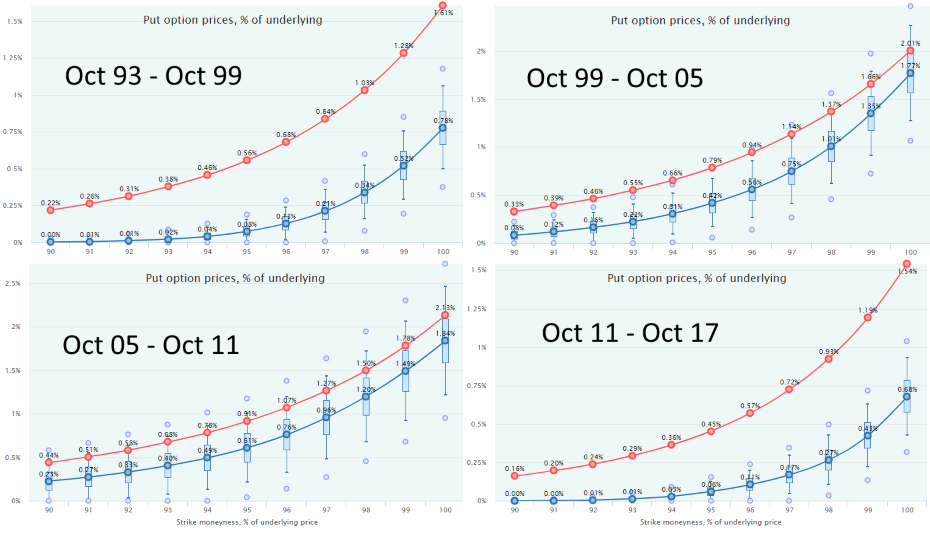
Even if we slice this period into 4 equal intervals, 6 years long each, the overpricing pattern remains intact. Only in the periods comprising two recessions and bear markets (1999-2005, 2005-2011), the put options were priced somewhat closer to their Fair Values. In the other, bull markets, they were hugely overpriced.
If we exclude the periods of the economic downturn with the help of The Conference Board Leading Economic Index (LEI) by filtering out all the dates when its 6-month Rate-of-Change was below -2%, we get even more interesting disposition.

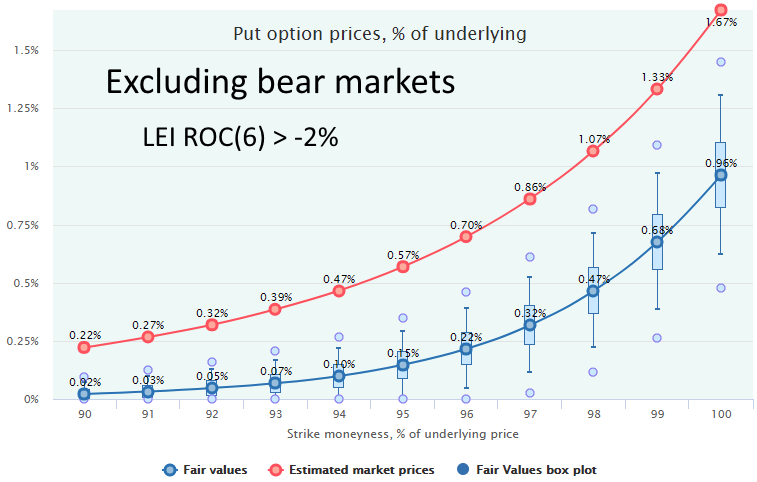
So, excluding the recessionary environment, put options were overpriced by the market in several times, especially farther OTM.
Below are the performance metrics of the SPY Credit Put Spread strategy for the period of September 1993 - September 2017 without any filtering and with commission of $1 per option.
We see a quite attractive expected profit:
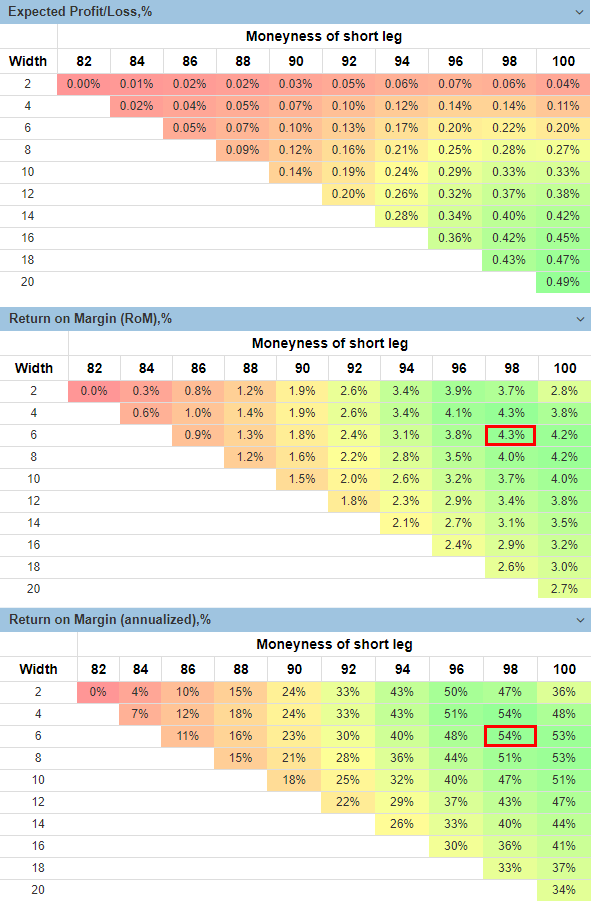
In the area of 96-100 short leg moneyness and 4-8% width, such a spread has an expected Return-on-Margin (RoM) of a quite appealing level - more than 50% annualized. Excluding the bear markets with the LEI ROC(6) indicator, this performance is even better — 80-90% annualized. In comparison, the average 4-week total return of SPY for the same period was 13.83% annualized.
The best legs combination of a spread seems to be the one with 98 short leg moneyness and 6% width (i.e., long leg moneyness of 98-6=94). It has 4-week average RoM of 4.3%, or 54% annualized, see the matrices above.
However, if we look at the risk metrics and risk-adjusted performance for this spread strategy, the picture will be not so bright.
Here is a histogram of its returns distribution (Return on Portfolio with 100% position size, i.e., 100% margining):
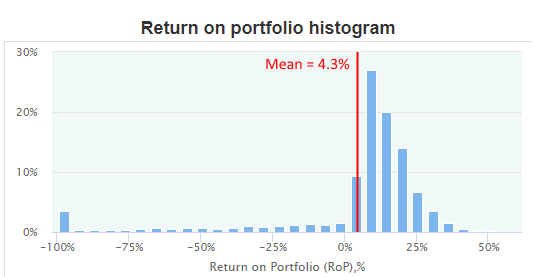
The significant negative "fat tail" is quite obvious, including a rather sensible number of the whole portfolio loss, see the leftmost bar. On the bright side, the strategy has the major probability density in the positive area: the overall loss probability is just 16.7%.
With such a negative tail and huge drawdowns, the position sizing is extremely crucial. Overbetting with returns compounding will inevitably lead to the loss of the whole portfolio, and, of course, 100% margining will quickly end up in such a loss. The OptionSmile platform calculates the Kelly criterion and Optimal Position Size for this strategy at 29% and 38% respectively.
So, if we take the average of these two values and margin our account on 33%, it will lead us to the annualized Return on Portfolio of 54%*0.33=17.8% - not so overly exciting now.
Moreover, even this return comes at a high cost. Here is an annualized standard deviation of Return on Portfolio for our spread with 33% Position Size:
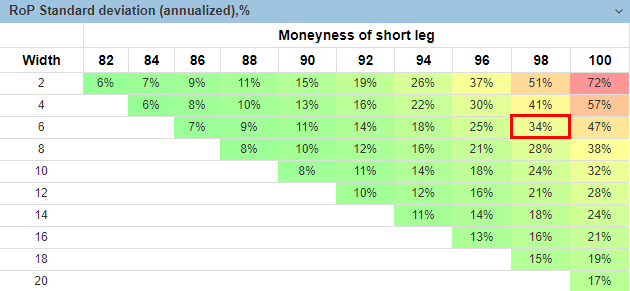
For our particular example (98/6 spread), the relatively appealing return of 17.8% also goes with high volatility - 34% annualized - and it does not look so attractive being taken on the risk-adjusted basis.
Furthermore, if we compound all these returns and calculate the Geometric average return for our portfolio with 33% position sizing, we will observe the infamous "volatility drag" in action:
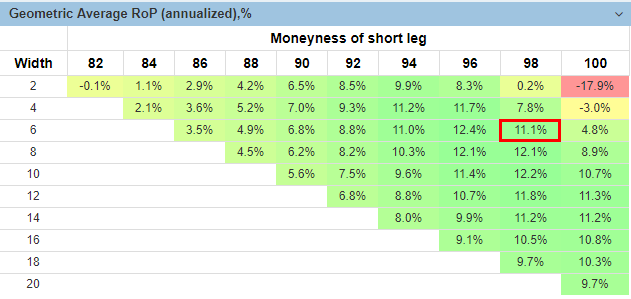
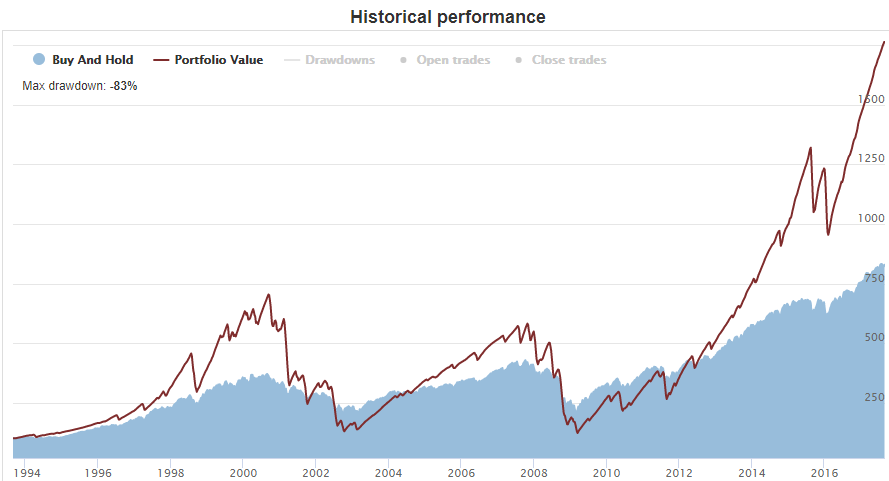
Here we see how 17.8% of arithmetical average (Return on Portfolio with 33% position sizing) turns into 11.1% geometric average return. This is an influence of big drawdowns, especially during the bear markets. Here is an equity curve of this spread strategy with compounding and the Laddering of 20 (deals made every day). Huge drawdowns are evident:
Obviously, with such a volatility, the Sharpe ratio is also not that impressive:
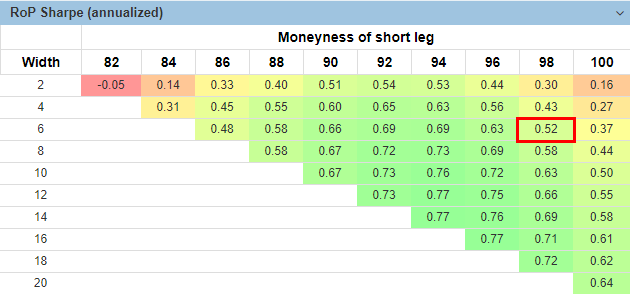
Our 98/6 spread has a Sharpe ratio of just 0.52. It is even less than the same metric for the outright buying of SPY - 0.58 (see the FilterBins table in the beginning). The more attractive Sharpe ratio is located in the area around the 94/12 spread. But even there, it is not overly exciting - around 0.77.
In other words, the puts selling's
high profitability has a price of a huge volatility and big drawdowns
Perhaps, this is the main reason for the “overpriced puts puzzle”. The risk-adjusted return of the "insurers" side of a hedging trade does not look so attractive, and those who are ready to take the risk of substantial drawdowns must be rewarded with that volatility premium.
Interestingly enough, on the call side, there is no such a phenomenon. Call options on the wide equity indices are fairly priced on average. For more, see our research Covered calls: less profit with less risk.