The equity markets are still in stress. All major indices did not manage to recover after being hit hard in the first weeks of October. It seems there are fewer bottom-fishers in the market this time. Meanwhile, historically speaking, an upward bounce is still very probable as all indices are in the oversold territory.
Options implied volatility is very hight what is reflected in the extreme levels of the Volatility Indices. That makes put options substantially overpriced. On the other side, given the high probability of the upward move, call options are mostly underpriced except for those in the near-term expiration which are not so cheap now and priced more fairly. It seems this is how the options market prices-in the upward bounce in the short term by bidding up this area of volatility surface.
Here is the mispricing summary for the series with 2, 4, and 6 weeks until expiration:
| Puts | Calls | ||||
| OTM | ATM | ATM | OTM | ||
| SPY |
2 weeks |
Overpriced substantially |
Fairly priced |
||
|
4 weeks |
Overpriced substantially |
Underpriced | |||
|
6 weeks |
Overpriced |
Underpriced substantially | |||
| QQQ | 2 weeks |
Overpriced substantially |
Fairly priced | ||
|
4 weeks |
Overpriced substantially |
Underpriced |
|||
|
6 weeks |
Overpriced substantially |
Underpriced substantially |
|||
| IWM | 2 weeks | Overpriced substantially | Fairly priced | ||
|
4 weeks |
Overpriced substantially |
Underpriced |
|||
|
6 weeks |
Overpriced substantially |
Underpriced substantially |
|||
All mispricing opportunities are in the direction of the upward move: selling puts (or put spreads) for those who can bear huge volatility and buying calls for more conservative strategies, except for the nearest calls (this area looks overcrowded for now).
To make our estimation more reliable, we filter the historical data and select from the past only those dates when the market resembled the current condition (read more here). We use three filters:
For SPY and QQQ, we apply auto filtering for Volatility index and RSI selecting 300 days in history with the shortest Euclidean distance to their current values.
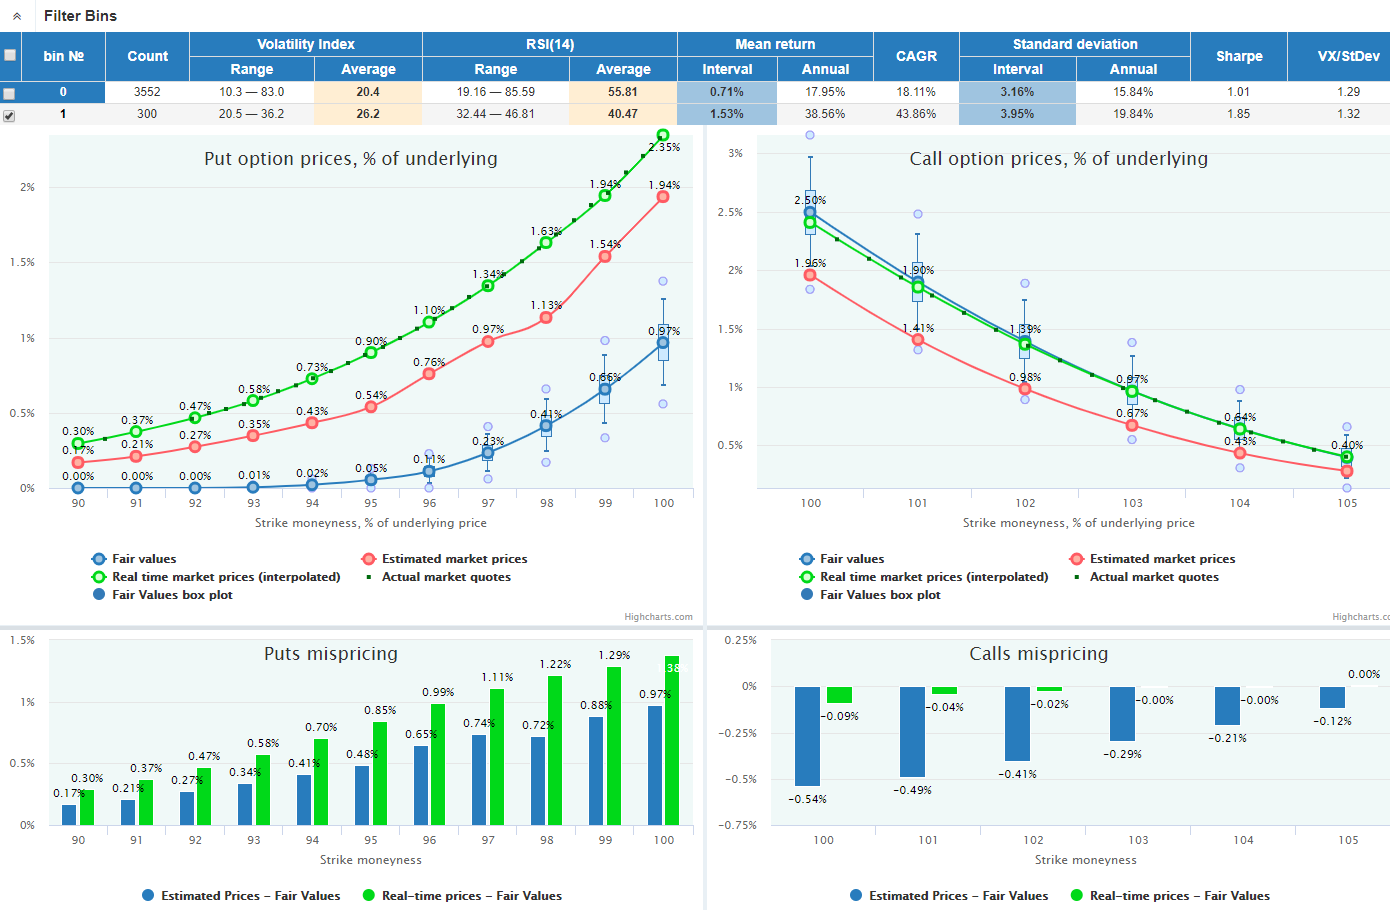
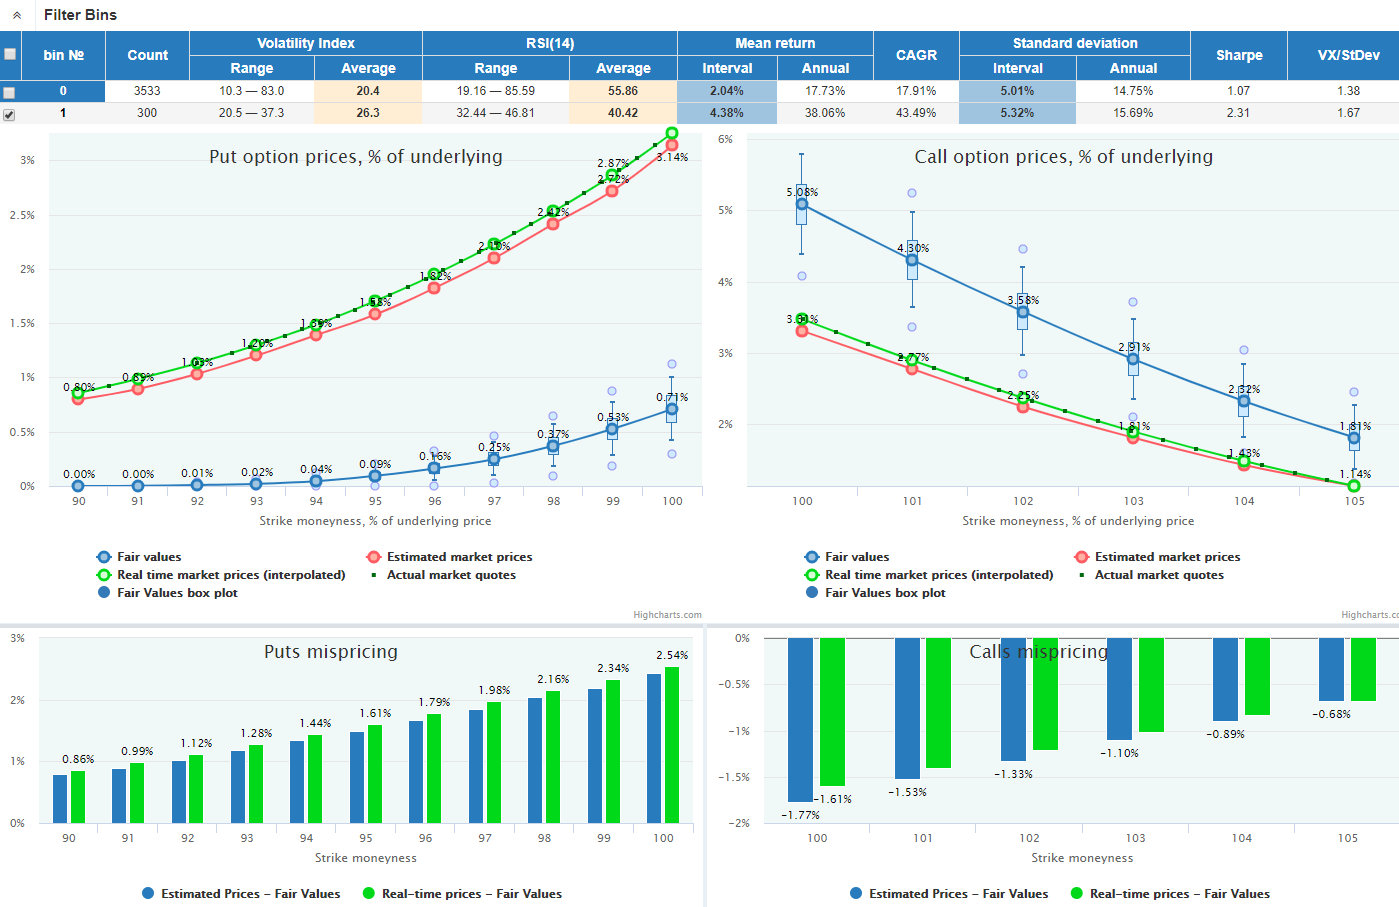
For each underlying, we select expirations on 2, 4, and 6 weeks and present options Fair Values and Market Prices, both historical (red line) and current real-time (green line). The market prices of these two types can sometimes diverge from each other if the current market condition (volatility surface) differs from its average state in the history.
SPY has had another rough couple of weeks struggling to bounce up. RSI(14) is still in the oversold area.
VIX is still near its extremes reflecting the huge amount of stress in the markets:
Puts are substantially overpriced; calls are priced almost fairly.
Puts are substantially overpriced; calls are underpriced.
Puts are overpriced; calls are substantially underpriced.
QQQ did not manage to recover and is also in the oversold area:
VXN is also on the extreme levels:
Puts are substantially overpriced; calls are priced fairly.
Puts are substantially overpriced; calls are underpriced.
Puts are substantially overpriced; calls are substantially underpriced.

IWM has continued its downtrend after the timid correction. RSI(14) still demonstrates an extremely oversold condition:
RVX in also on its extremes.
Puts are overpriced; calls are priced fairly.
Puts are substantially overpriced; calls are underpriced.
Puts are substantially overpriced; calls are substantially underpriced.