Volatility is back. It has returned the way it happened just a couple of times in the last years, quite abruptly. Equity markets suffered a sharp selloff last week, volatility indices jumped to the levels last seen in April this year.
All equity indices entered the oversold domain. Historically speaking, the probabilities of bouncing back are much higher than the continuation of the fall as the macroeconomic conditions look solid (although, high price volatility ahead is guaranteed). That expected move and the inflated IV make put options hugely overpriced and calls underpriced across all the underlyings and expirations.
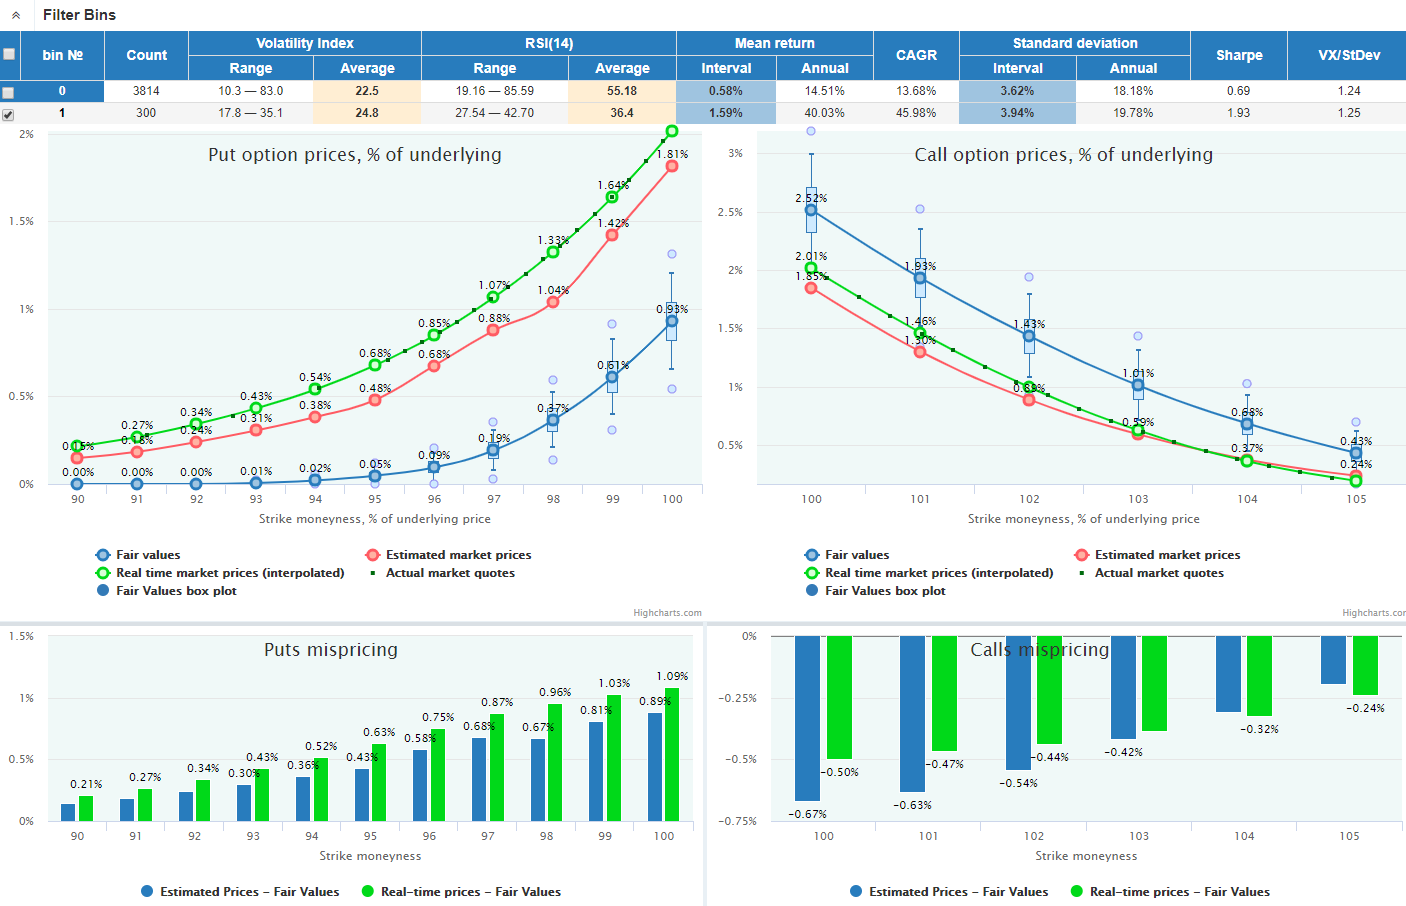
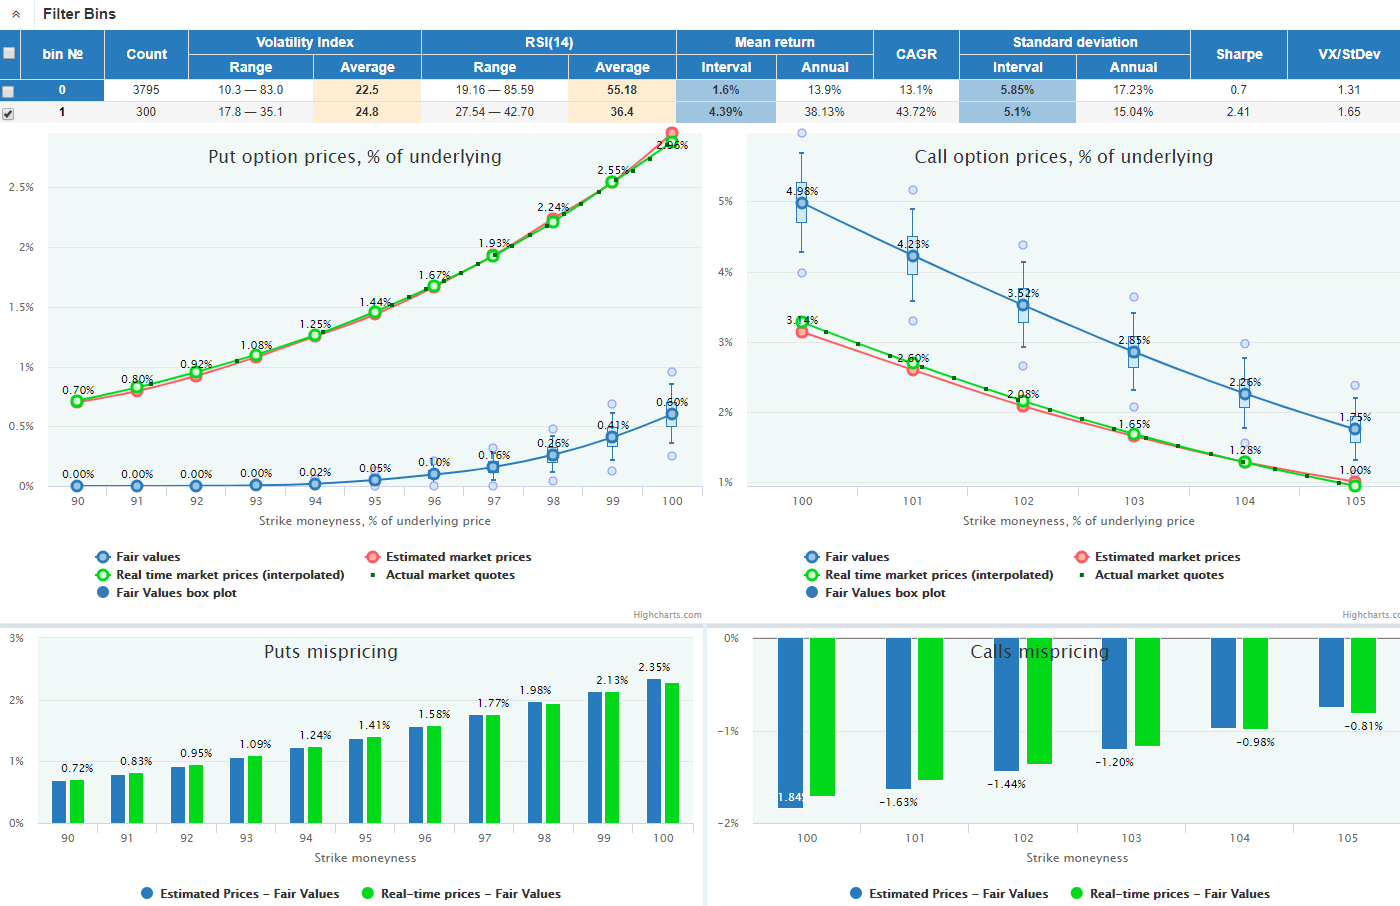
Here is the mispricing summary for the series with 2, 4, and 6 weeks until expiration:
| Puts | Calls | ||||
| OTM | ATM | ATM | OTM | ||
| SPY |
2 weeks |
Overpriced substantially |
Underpriced |
||
|
4 weeks |
Overpriced substantially |
Underpriced substantially | |||
|
6 weeks |
Overpriced |
Underpriced substantially | |||
| QQQ | 2 weeks |
Overpriced substantially |
Underpriced | ||
|
4 weeks |
Overpriced substantially |
Underpriced |
|||
|
6 weeks |
Overpriced substantially |
Underpriced substantially |
|||
| IWM | 2 weeks | Overpriced | Underpriced | ||
|
4 weeks |
Overpriced substantially |
Underpriced substantially |
|||
|
6 weeks |
Overpriced substantially |
Underpriced substantially |
|||
For those who can withstand huge volatility, overpriced put options can provide good opportunities to sell (with proper tail hedging, solid money management, and position sizing). Despite the inflated implied volatility, calls options are good for buying as the historical distribution indicates the high probability of the upward bounce.
To make our estimation more reliable, we filter the historical data and select from the past only those dates when the market resembled the current condition (read more here). We use three filters:
For SPY and QQQ, we apply auto filtering for Volatility index and RSI selecting 300 days in history with the shortest Euclidean distance to their current values. For IWM, we use manual filtering.
For each underlying, we select expirations on 2, 4, and 6 weeks and present options Fair Values and Market Prices, both historical (red line) and current real-time (green line). The market prices of these two types can sometimes diverge from each other if the current market condition (volatility surface) differs from its average state in the history.
SPY has dropped sharply and entered the oversold area according to RSI(14).
VIX surged to its highs since April this year:
Puts are substantially overpriced; calls are underpriced.
Puts are substantially overpriced; calls are substantially underpriced.
Puts are overpriced; calls are substantially underpriced.
QQQ has also dropped sharply and entered the oversold area:
VXN has jumped to its highs since April this year:
Puts are substantially overpriced; calls are underpriced.
Puts are substantially overpriced; calls are underpriced.
Puts are substantially overpriced; calls are substantially underpriced.

IWM has actually formed a local downtrend having lost more than 10% in a couple of weeks RSI(14) demonstrates an extremely oversold condition not seen for a long time:
RVX in its highs as it usually happens in such a market.
Puts are overpriced; calls are underpriced.
Puts are substantially overpriced; calls are substantially underpriced.
Puts are substantially overpriced; calls are substantially underpriced.